How to understand a team’s plan of attack using homemade shot maps
Can you understand a team’s attacking style by watching highlights of their games on YouTube and creating shot maps?
I had some time over Christmas so decided to give it a go.
I picked three teams currently doing well at Steps 3 and 4:
- Folkestone Invicta and Carshalton Athletic of the Isthmian Premier.
- Cray Valley (PM) in the Isthmian South East.
The criteria I used was nothing more than they upload all their highlights to YouTube.
Then I thought I might need a team to use for comparison. One that wasn’t doing so well. I couldn’t find a team at that level with clips available, so I had to look a bit higher. Step forward…
- Billericay Town of the National League South.
Here’s how I went about this.
Going through each clip I tracked every shot on goal, the type of shot it was (foot, header, free kick), and which shots became goals. From that, I split all that information into individual maps to make it all a bit clearer.
Then, because I couldn’t help myself, I did an extra one showing an individual player shot map. You can see that one at the end of this post.
You’ll see there are three maps for each team, involving games up to Christmas (approx). They cover…
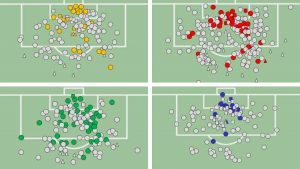
- Shots on goals, including goals (shown in the colour of that team).
- Just goals
- Headers
That’s enough preamble. Let’s get to the first team…
Folkestone Invicta shot maps (minus five games)
Folkestone Invicta are in that bottleneck of teams behind league leaders Worthing in the Isthmian Premier (Step 3). Up to Christmas they’d only lost two games in the first half of the year. Right now they’re probably the best of the four teams I looked at.
Above: Folkestone have more goals from inside the 6-yard box with a lot of crosses from both sides.

Above: The concentration of goals from inside the 6-yard box.

Above: A lot more headers than other teams. An emphasis on crossing, with five goals from 21 headers on goal

MY NOTES
Watching clips, and watching them play Merstham on Boxing Day, there’s an obvious emphasis on crosses. Folkestone have quick wingers (and quick full backs) and get players into the box in numbers. That might explain the number of headers, and the cluster of goals in the 6-yard box.
Onto the next team…
Carshalton Athletic shot maps
Carshalton Athletic were about mid-table in the Isthmian Premier (Step 3) when I put these together, but with games in hand. I’ve seen them three times this season and they’ve looked convincing every time. They also recorded a 5-0 win over Folkestone.

Above: Lot of shots, and a concentration of them in the centre.

Above: Individual goals, most in front of the 6-yard line

Above: Seven goals from 20 headers on goal
MY NOTES
Lots and lots of shots. Carshalton are an attacking team. They shoot from outside the box as well, cutting into the halfspaces from wide or through the centre.
Compared to what you’ll see from Cray Valley below, there’s a lot more action in the air, but the bulk of their goals come from the area in front of the 6-yard line.
On to the next team…
Cray Valley (PM) shot maps
Cray Valley (PM) were second in the Isthmian South East (Step 4) when I created these maps. I’ve seen them twice this year, including their win over Hastings. They’re fun to watch and I’ve written about them before. In case you’re wondering, the PM stands for Paper Mills.

Above: Not many attempts from wide. Most shots taken from central areas.

Above: Plenty of goals, but only two headers.

Above: The headers. Eight in total, two of which became goals.
MY NOTES
Cray Valley have been using wing backs this season. In the games I saw they focused more on working the ball into the box rather than crossing from wide. Perhaps this is reflected in the lack of headers.
The maps also suggest some level of shot discipline (that might not be the correct terminology). Of the four teams, Cray Valley had the fewest shots outside the box. I’m sure that’s subjective, but it would be something to think about for an opposition report.
Onto the last of the four teams…
Comparison
After putting these three together I looked up Billericay’s videos from the National League South.
For context, they were (and still are) rooted to the bottom of the table, and strong relegation candidates. I didn’t pick them for that reason. I simply looked for a team with all their highlights on YouTube, starting at the bottom of the table intending to work up. It didn’t take long.
Billericay Town shot maps

Above: Interestingly the pattern look largely the same, just with fewer shots and goals

Above: A total of only 14 goals, including one penalty. Mostly from close range.

Above: The most headers of any of the four teams here. But only two goals.
MY NOTES
The overall shot map looked a lot like the others. But when you go through the layers there are fewer shots, more taken from distance, and obviously fewer goals.
And as the last image shows, there’s a bigger emphasis on headers. How much of that is the game plan on Billericay, and how much of it is a more risky long ball into the box approach? I don’t think the answers are above, but it’s the sort of thing that you might spend time investigating.
(Bonus) player shot map
A few players stood out as I was putting these together. They were almost impossible not to enjoy watching.
I couldn’t do maps for them all (honourable mentions to Marcel Barrington at Cray Valley, and Scott Heard at Folkestone), but did create one…
Lewis White (Carshalton Athletic)
White plays as a winger or number ten. He’s one of those players who pops up everywhere and causes the opposition problems.

MY NOTES
From this, I’d say White gets in the box, plays across the pitch, and shoots from both sides.
But the map doesn’t say anything about his technique and skill. Or that most of these shots came after beating defenders on dazzling runs into the box. So perhaps there’s a limit to what you can take from them.
That said, when you see him play in person, in positions that require him to support attacks rather than get on the end of them, perhaps the map above takes on more context. With both sets of information you start to get a better picture of him as a player.
How to do this yourself
Thanks for taking a look at these. I had a lot of fun putting them together so I hope you found them interesting.
You could easily do this sort of thing yourself. I haven’t used any special software, it’s just Powerpoint, but you could get the same information with pencil and paper.
Everything is very simple (and I can’t promise every shot is marked with pinpoint accuracy). But if you’re stuck on that and want to know more, feel free to get in touch.
You could also go into much more detail.
I haven’t noted blocked shots or whether a shot was on target. You could do that quite easily. I also confess to keeping some information back. Anything super-relevant went into the Folkestone report I was working on for Margate. That’s what prompted this little project to begin with.
Lastly, I’m not saying anything here is good or bad. I’m only looking at what actually happened. The information from these shot maps can be interpreted in various ways. This is just my version. I’d love to hear what you think in the comments.